
Mapping Hospital Data:
From ERD to Live Monitoring
This practice demonstrates a small-scale hospital ERD with five entities, SQL scripting to derive key metrics, and a monitoring view that updates in real time as new patient data is entered.

Entity Relationship Diagram
A simplified hospital ERD, created using Draw.io, illustrates five core entities: Visit, Patient, Treatment, Doctor, and Department. The diagram includes connecting lines and notations to represent their relationships.

Scripting in DB4S
The top part shows SQL queries that derive key metrics from the synthetic hospital data for daily monitoring. The bottom part demonstrates adding a new patient record on 2025-09-15, all executed in DB Browser for SQLite.
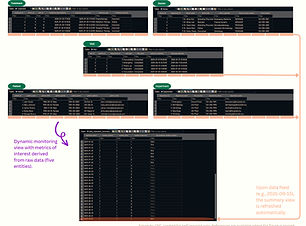
Dynamic View
The daily monitoring view dynamically tracks four key metrics: # patients, # visits, # treatments, and average treatment duration (minutes). It updates automatically, and a new entry in the View is highlighted in orange.
Inspired by the Shell and Git session for the Machine Learning Software Foundations Certificate at the Data Sciences Institute, University of Toronto.